Monthly Data Snapshot
How has the cost of living changed?
Color-coded by direction
(green = cheaper, red = more expensive).

A new lens on cost, value, and inflation
The BVI is a modular, asset-agnostic cost-of-living valuation engine. It challenges fiat-centric thinking and asks: What happens when we stop measuring value with a currency that has lost 98% of its purchasing power since 1913?
Because the CPI is broken.
The Consumer Price Index (CPI) was meant to reflect the rising cost of living. Unfortunately, it has become a dense, politically influenced metric built on substitution bias, quality adjustments, and ever-changing assumptions.
While inflation eats away at purchasing power, the CPI says everything is "under control."
A 2–3% annual inflation target is sold as healthy. But over decades, it quietly siphons away wealth.
The BVI offers a transparent alternative.
What if the cost of living was not priced in dollars?
The dollar is a fiat currency — inflationary, trust-based, and engineered to decline.
The BVI doesn't just track cost. It redefines the measuring stick.
By pricing goods in alternate units of account, such as Bitcoin, Gold, and equities, the BVI reveals different stories about the same reality.
Change the denominator. Change the story.
The BVI introduces value units as new frames of reference:
(Click for current prices)
Each unit offers a different lens on affordability.
The BVI is more than a metric. It's a new mindset.
Cost tracking across real life.
A transparent, comparable, dynamic view of how cost and purchasing power evolve.
How has the cost of living changed?
Color-coded by direction
(green = cheaper, red = more expensive).
A visual tour of the data.
📱 Mobile Compatibility Notice: Interactive charts may not render or respond fully on mobile devices. For the best experience and full functionality (including dropdown toggles and chart interactivity), please view the Bitcoin Value Index site on a desktop or laptop.
Track cost changes in BTC terms since June 2010.
Declining index = fewer BTC (or sats) needed to live. Halving events are shown as reference points.
[Static Chart]
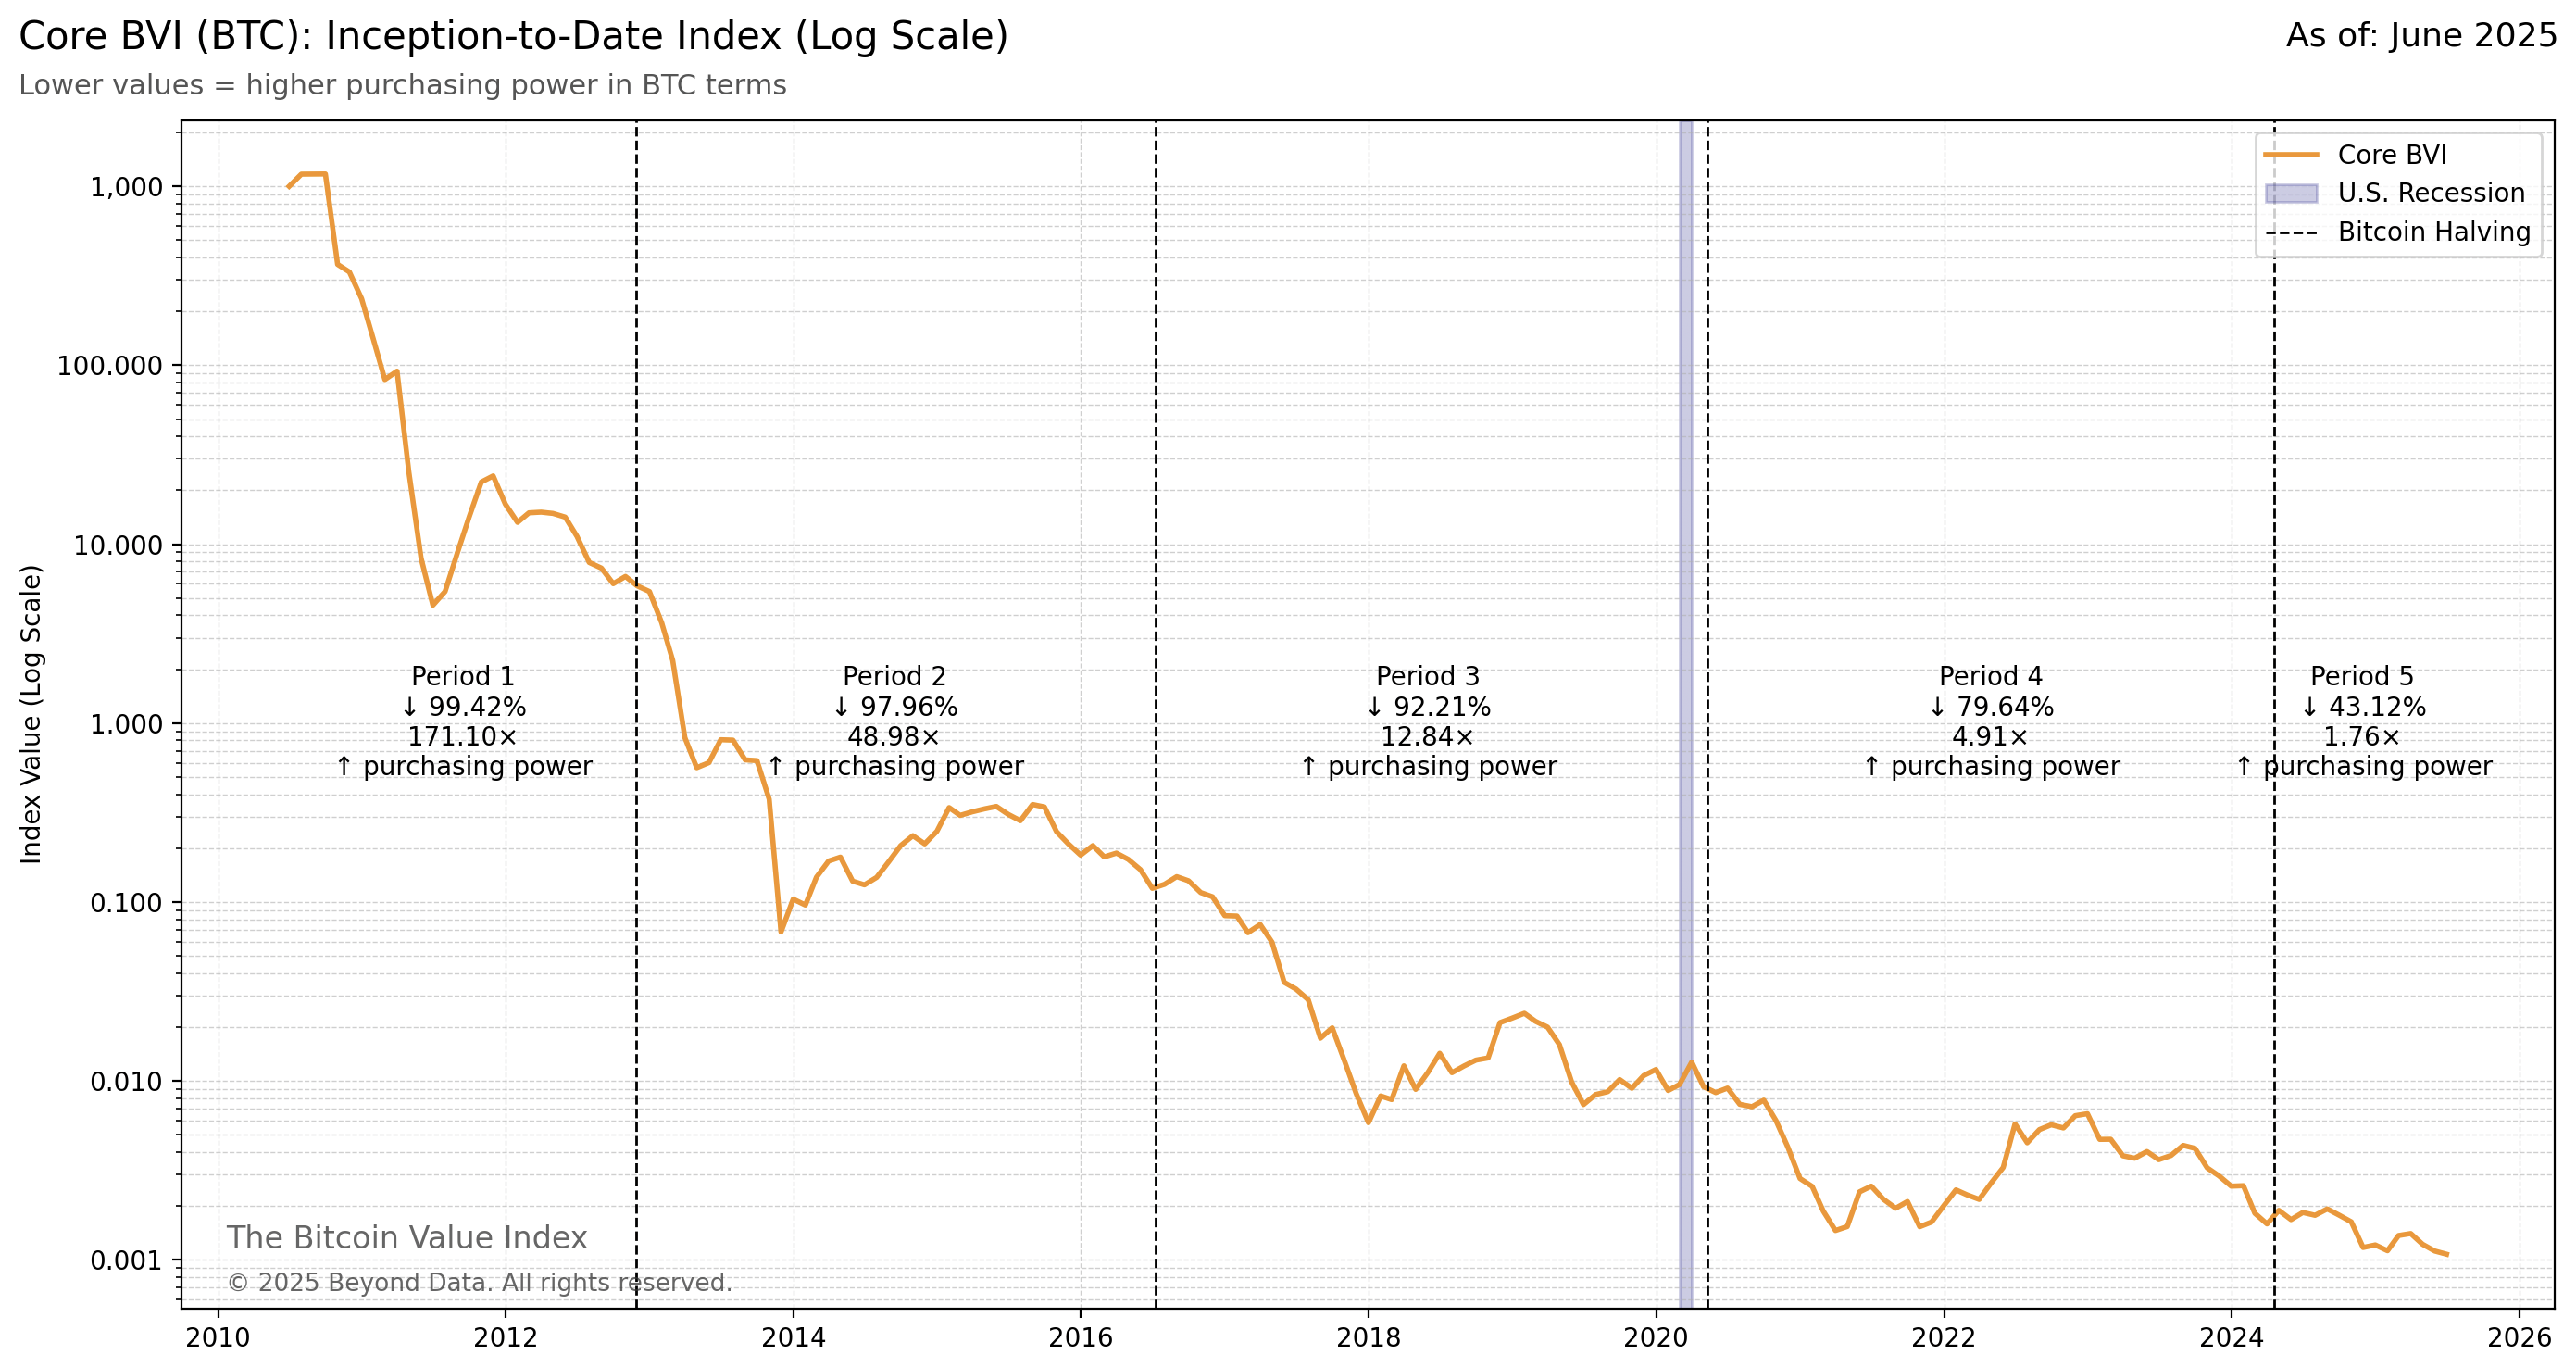
Sources: BLS, FRED, EIA, CoinGecko, Yahoo Finance
Component-level cost changes over the past year.
Color-coded by category and direction (green = cheaper, red = more expensive).
Note: toggle value units to see different perspectives.
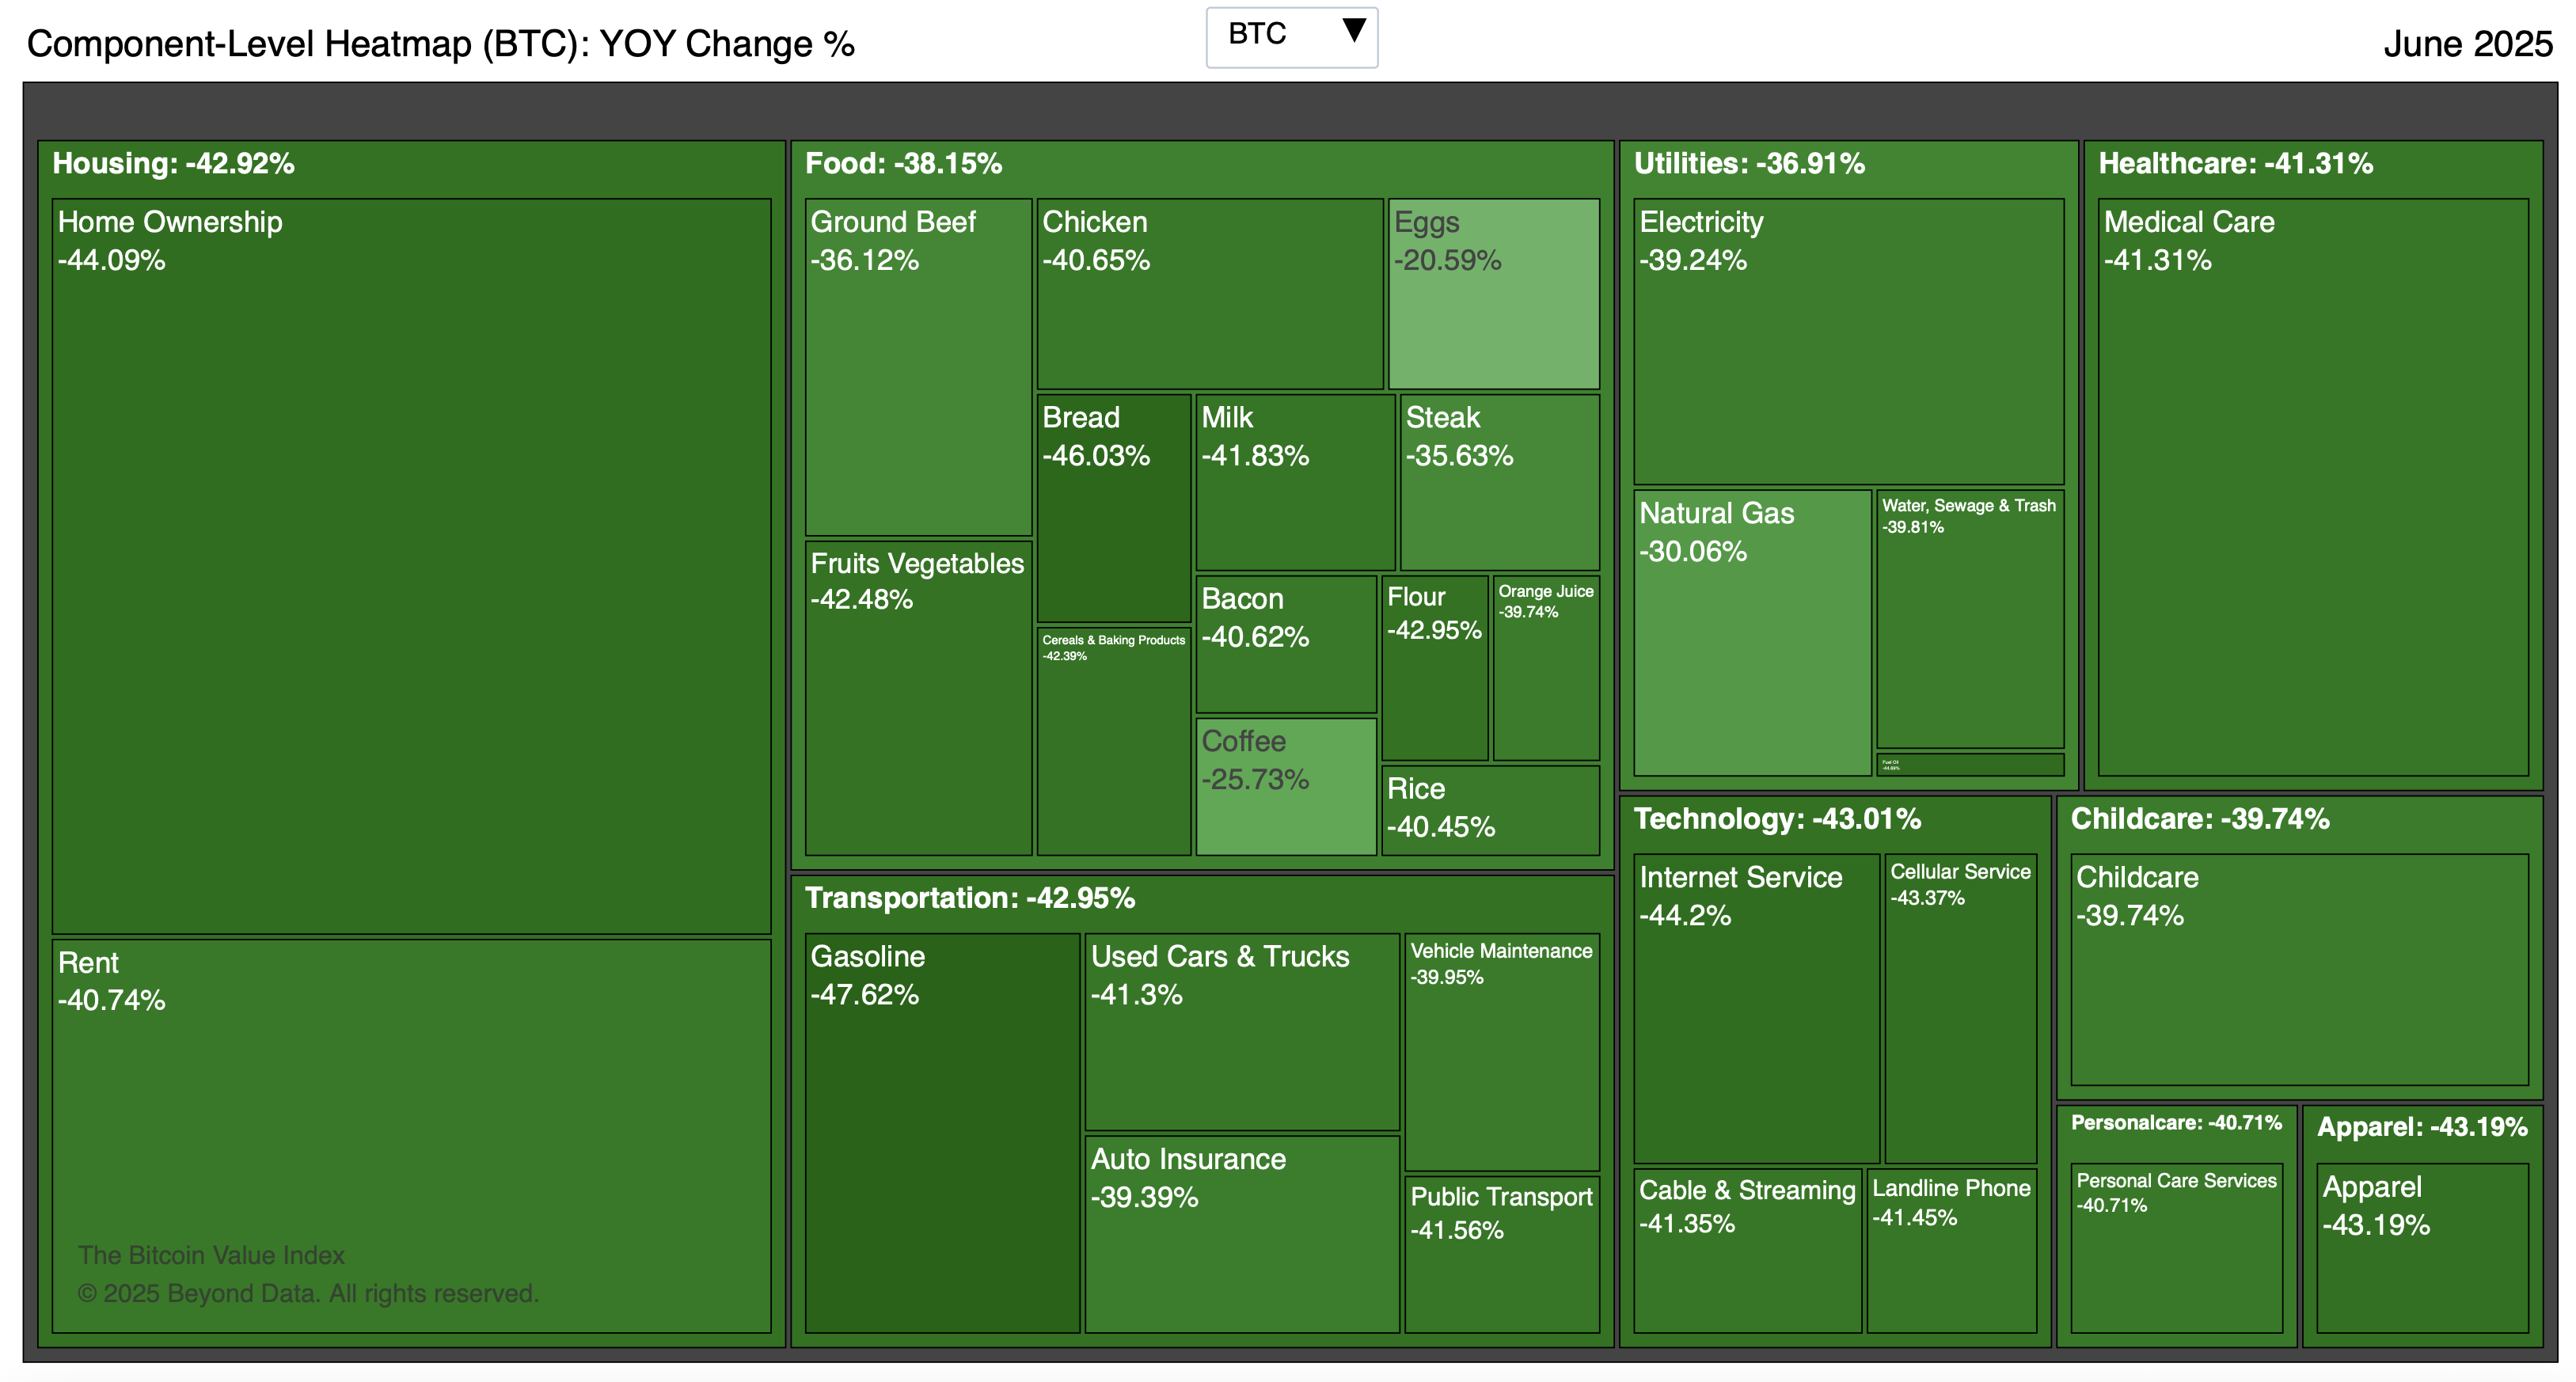
Sources: BLS, FRED, EIA, CoinGecko, Yahoo Finance
Rolling 12-month changes in the BVI (BTC) with a comparison series
Illustrates costs trends and volatility.
Note: toggle value units to see different perspectives.
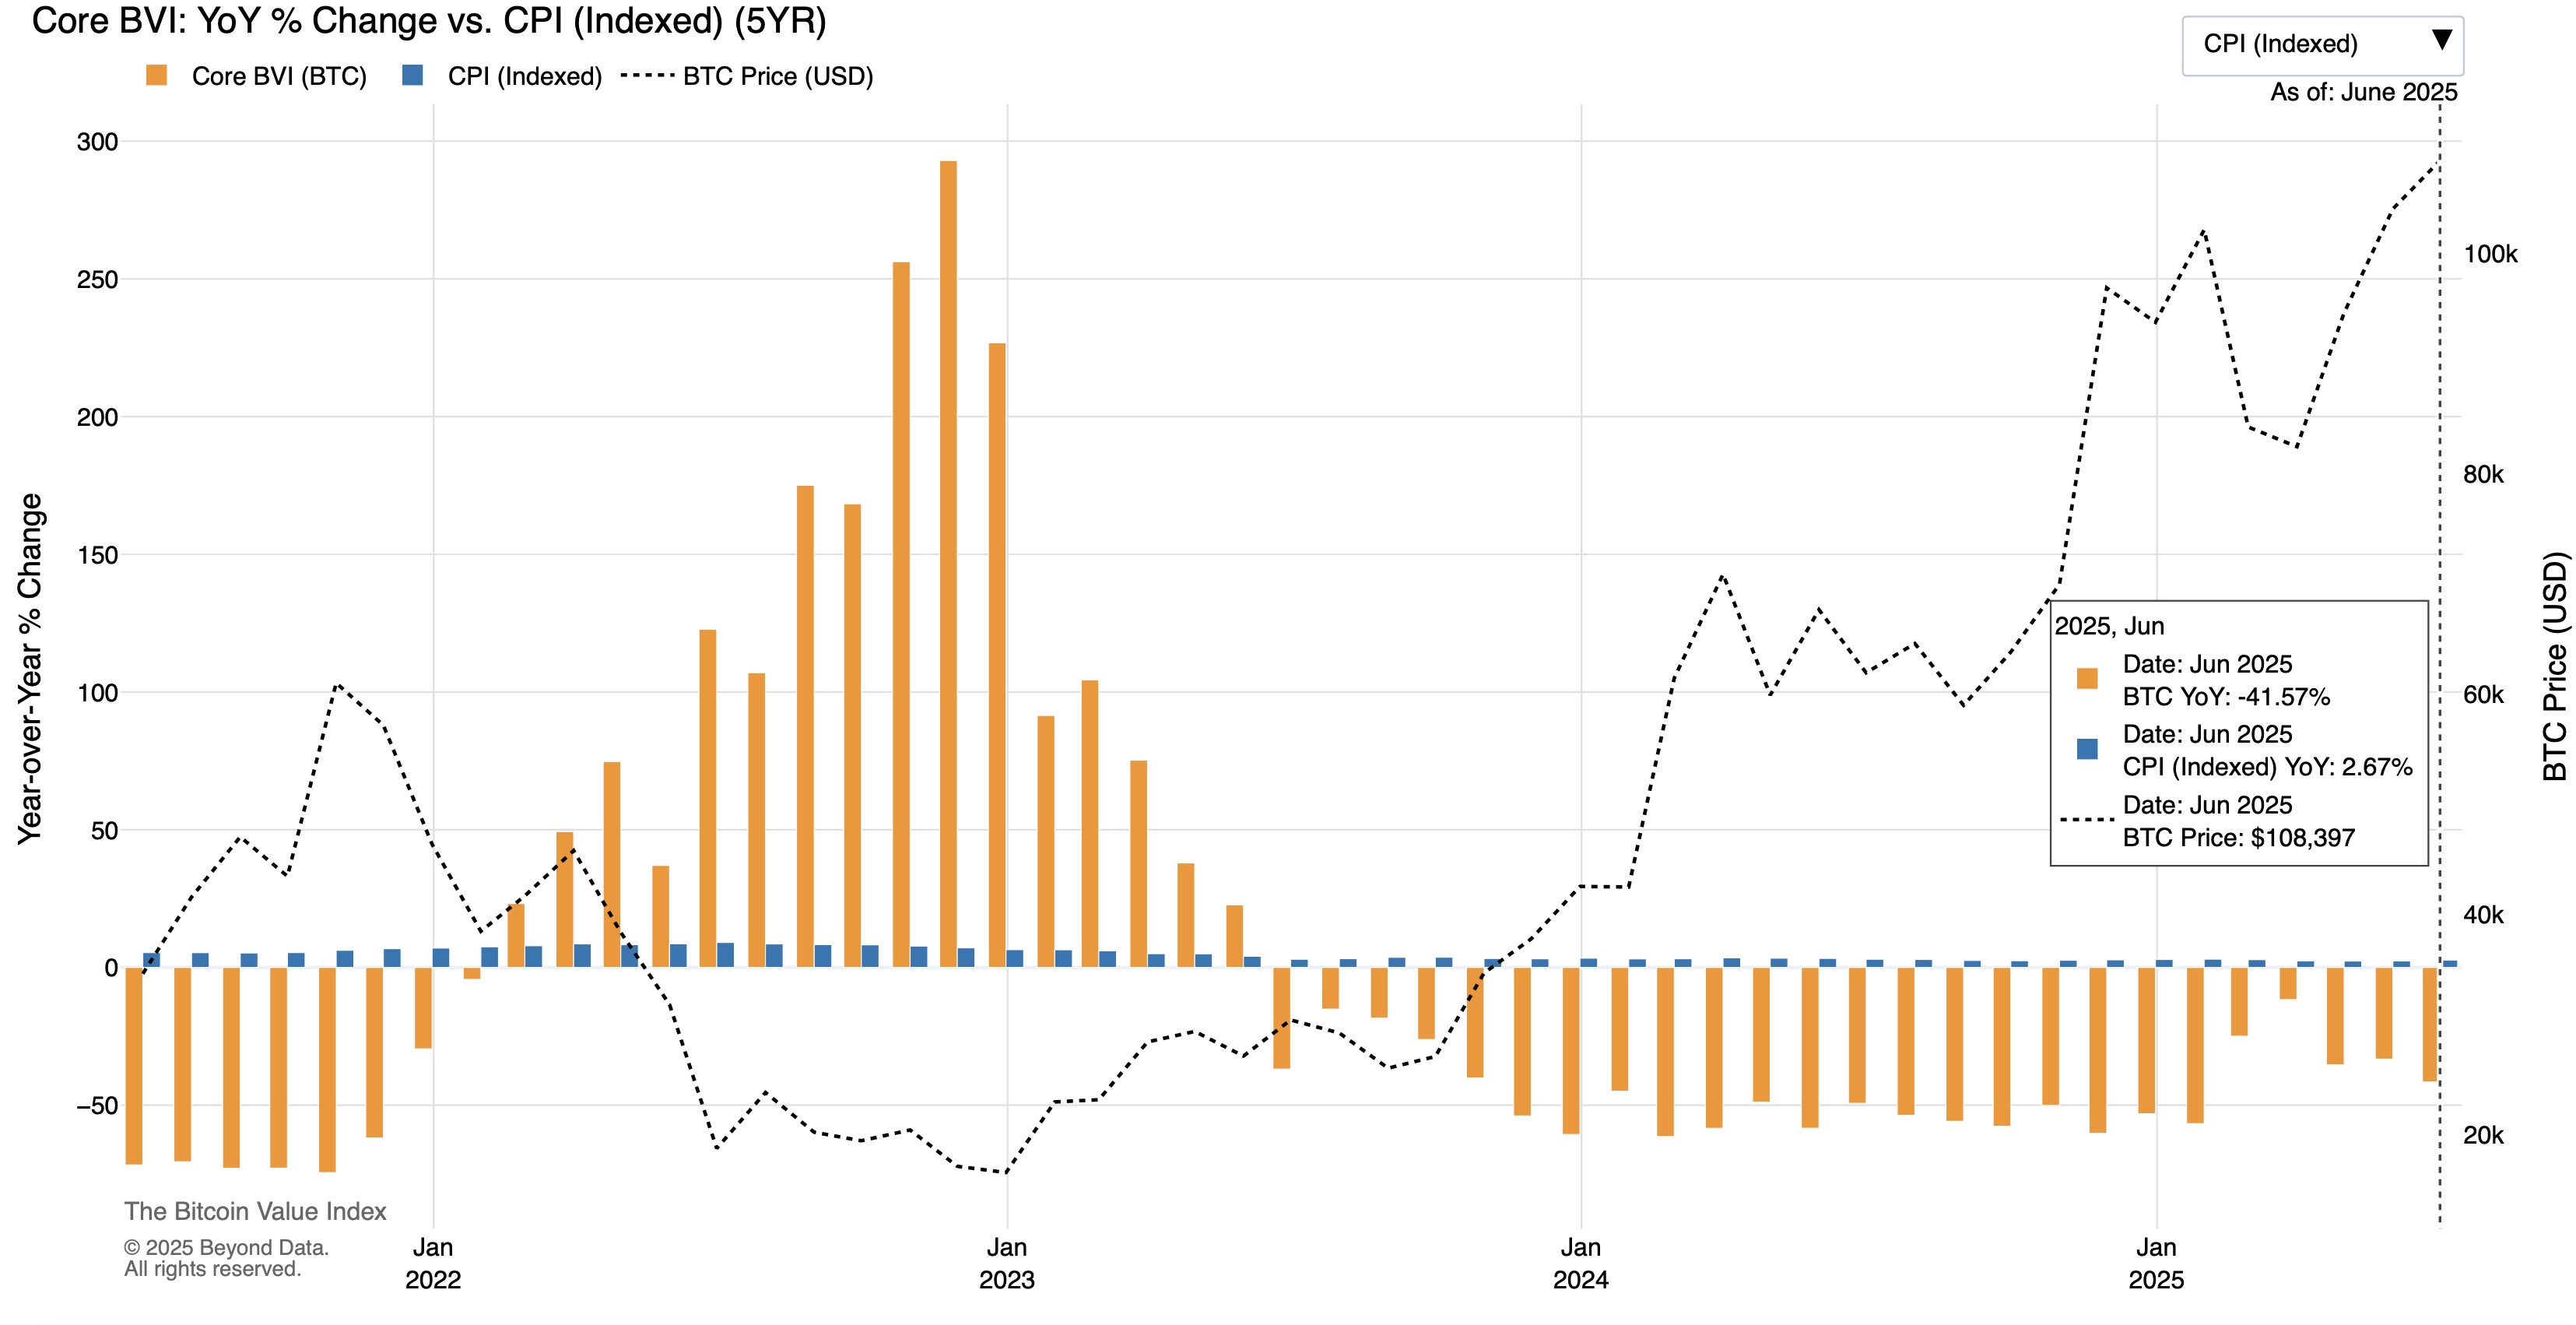
Sources: BLS, FRED, EIA, CoinGecko, Yahoo Finance
How much has cost changed over the past 3M, 1Y, 3Y, 5Y and 10Y periods?
Negative values = declining cost of living & increased purchasing power per value unit.
Visualize fiat decay and purchasing power changes using different value units.
Note: toggle value units to see different perspectives.
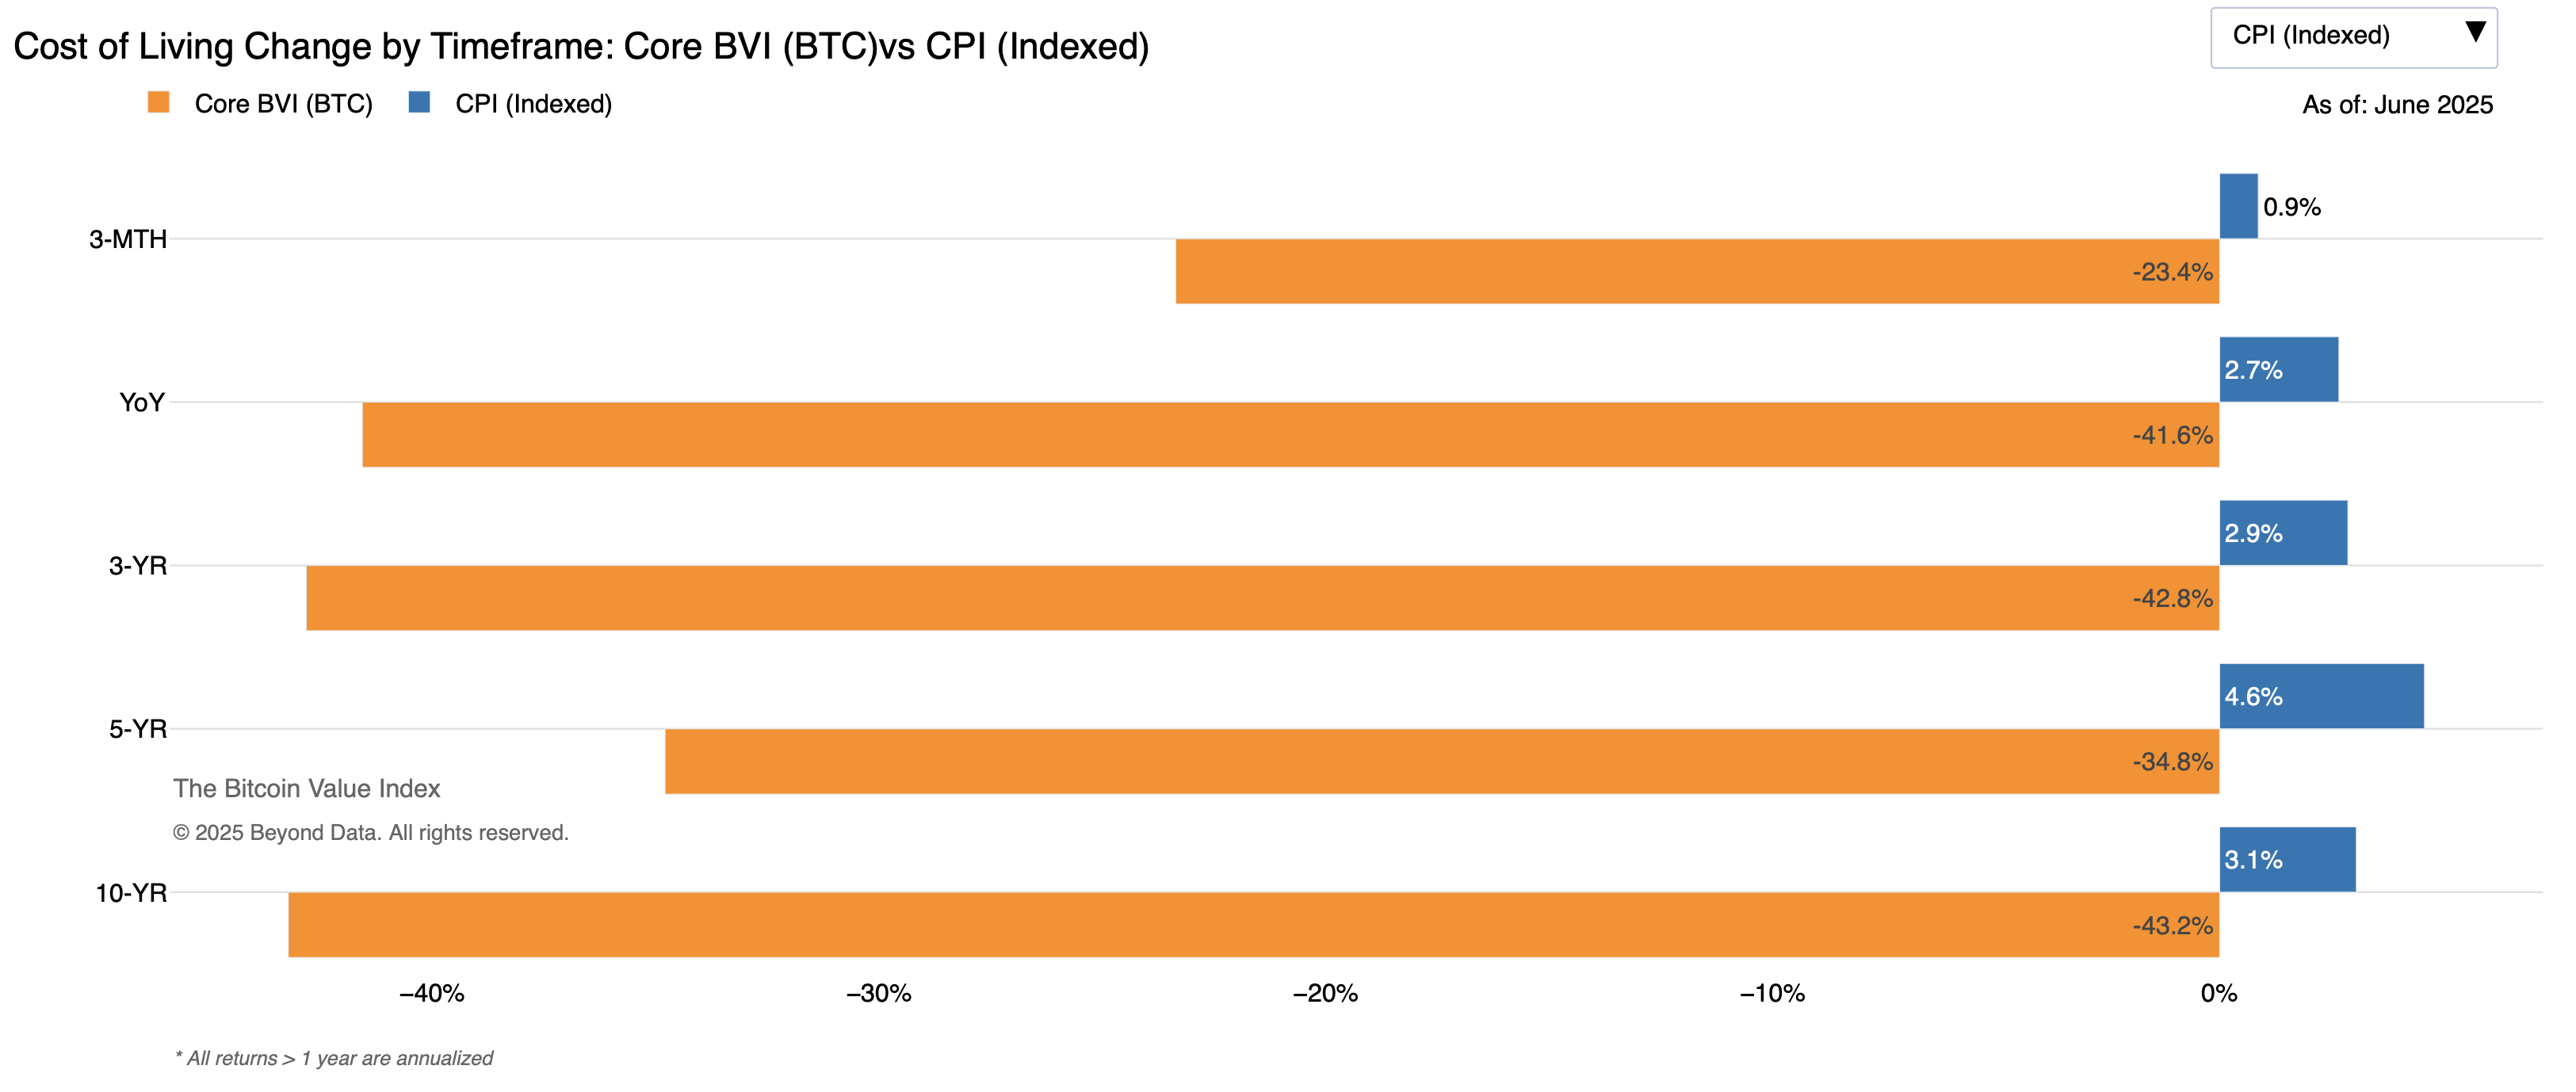
Sources: BLS, FRED, EIA, CoinGecko, Yahoo Finance
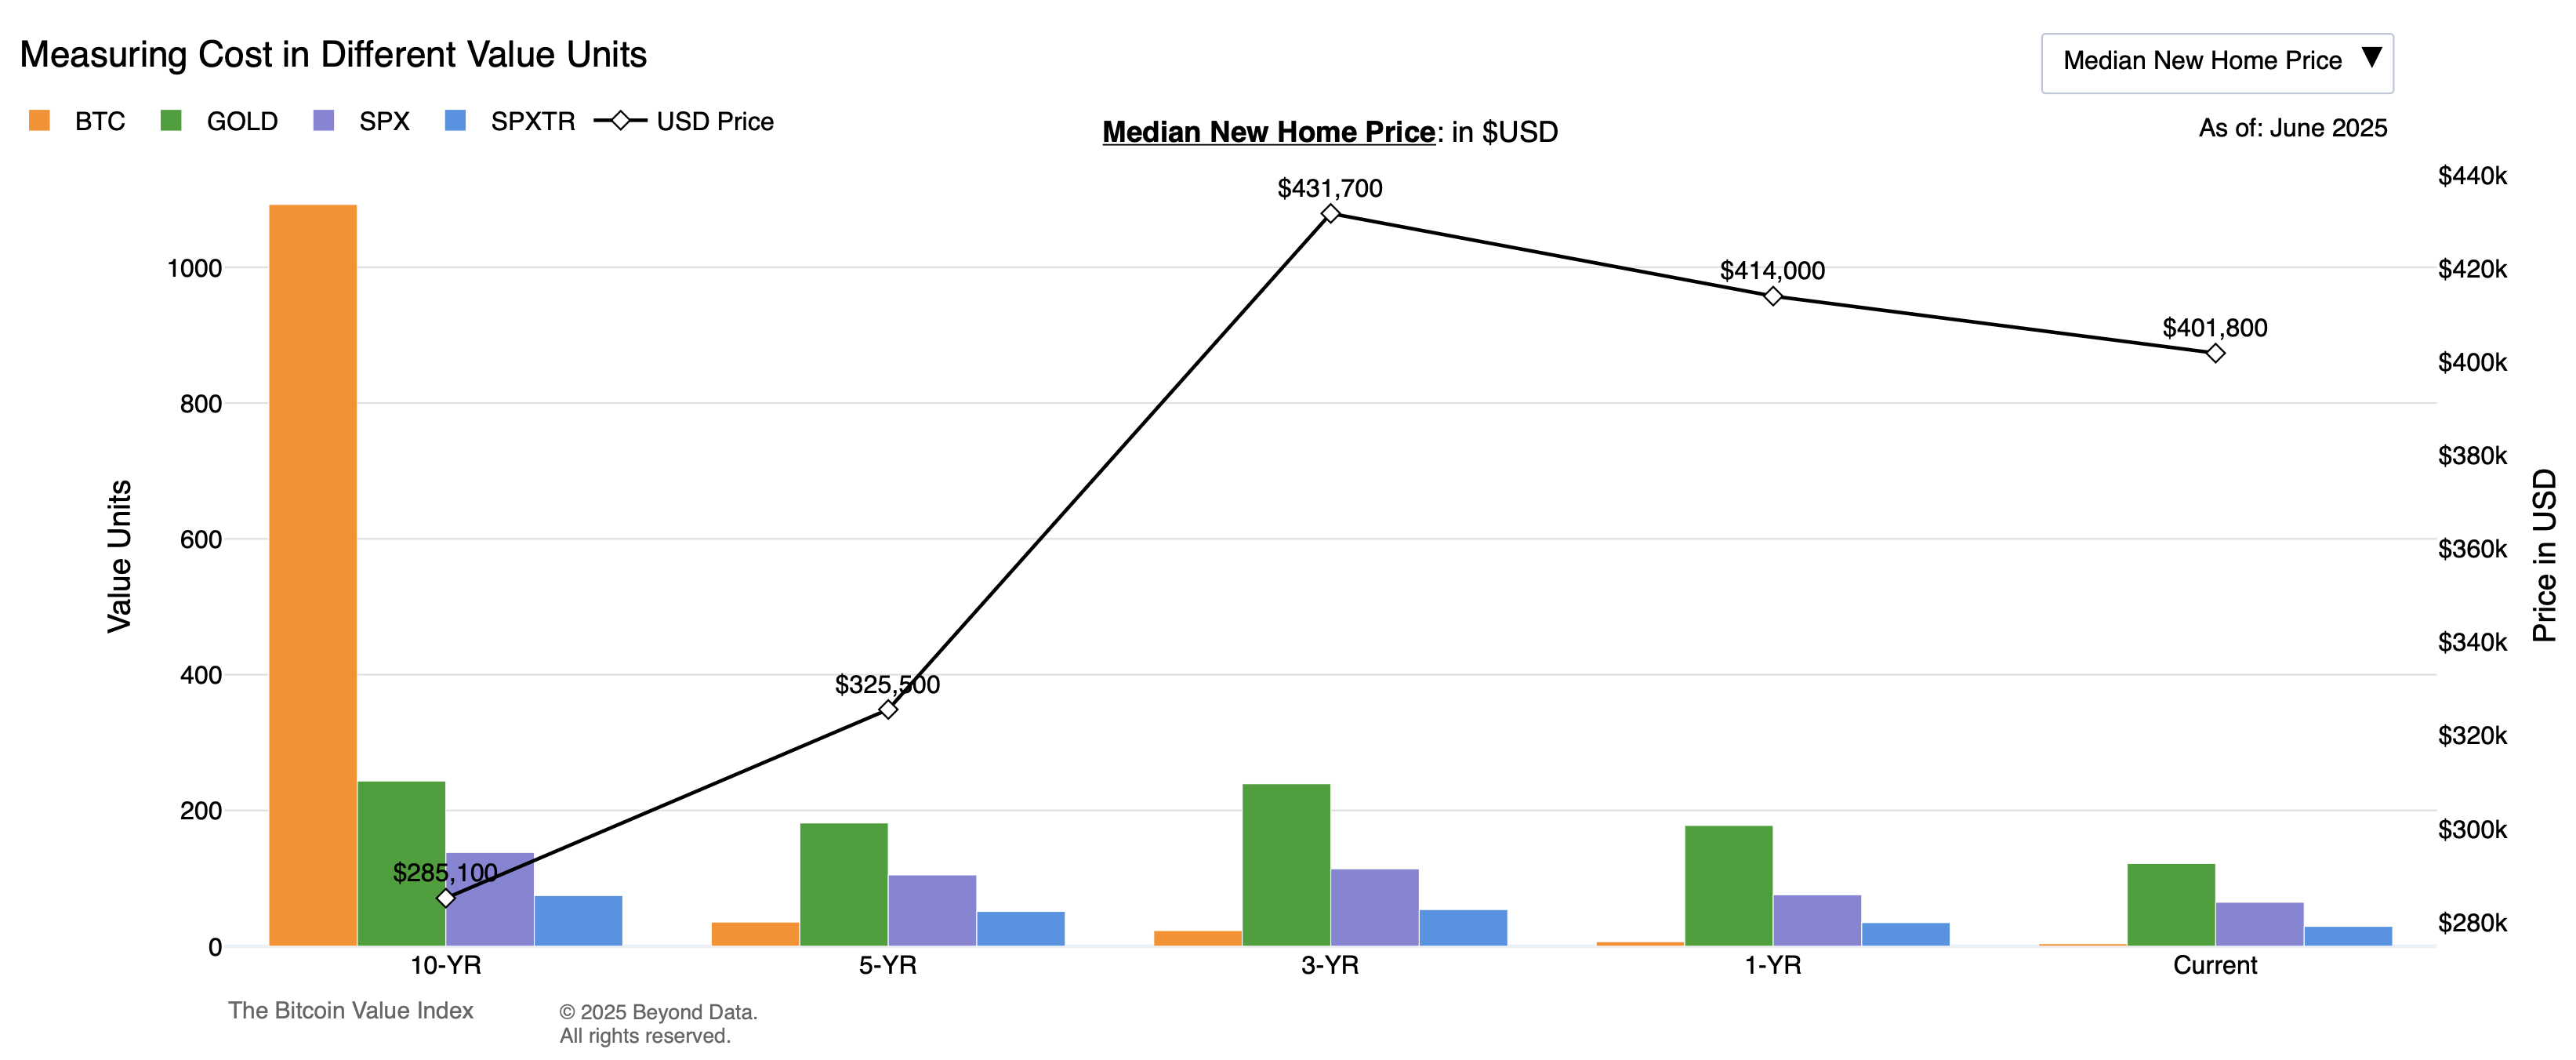
Explore the cost of specific items (e.g., home, eggs, electricity) across value units and timeframes.
An interactive chart + data table illustrating how inflation, deflation and purchasing power evolve over time by comparing the nominal USD price of an object to the cost in alternate units of account, with sats-level precision.
Sources: BLS, FRED, EIA, CoinGecko, Yahoo Finance
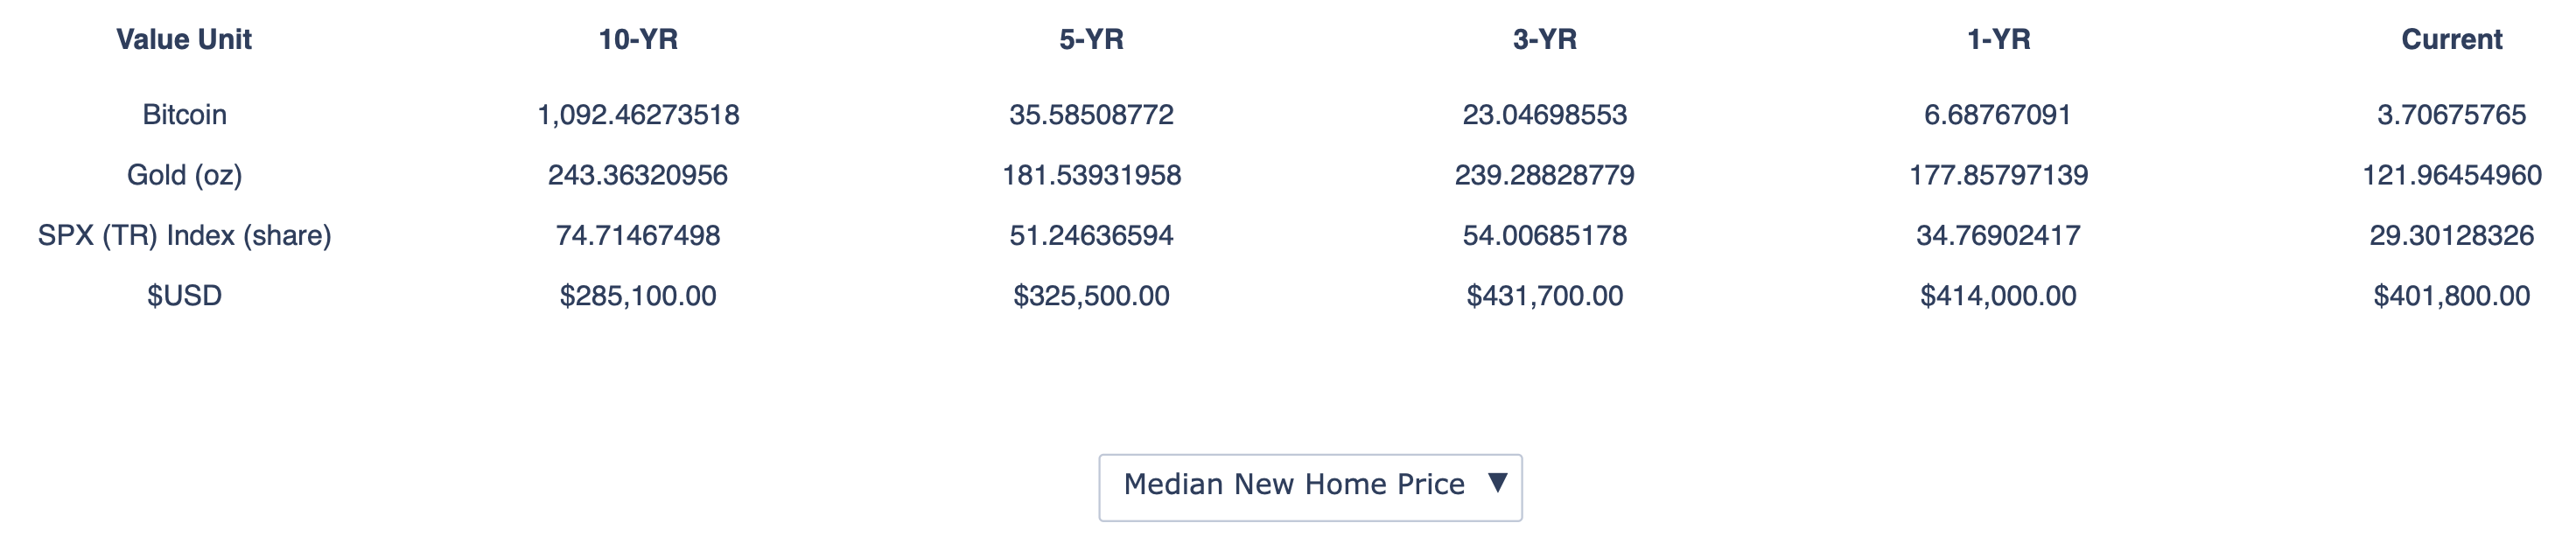
EXPLORE FURTHER: The data behind the chart.
Sources: BLS, FRED, EIA, CoinGecko, Yahoo Finance
The BVI is just getting started!
As trust in the fiat system and its legacy metrics continues to erode, the need for alternative frameworks will continue to grow. The Bitcoin Value Index aims to lead that shift by offering a transparent, modular system that evolves alongside markets, technology, and user needs.
The BVI is the first of many tools being developed by Beyond Data as a broader effort to reimagine how cost, value, and truth are measured in today’s economy and investment landscape.
Future updates will expand the BVI to include new value units, longer timeframes, and deeper analytics, offering individuals, institutions, policymakers, and educators better tools to understand real-world costs.
Educational only. Not financial advice.
For media, licensing, or technical inquiries: hello@bitcoinvalueindex.com
Use is permitted for personal, non-commercial reference.
All rights reserved.
© 2025 Beyond Data.
Bitcoin Value Index™ and Beyond Data™ are trademarks of their respective creators.